How to See Your Child's Grade History in Canvas (and Spot When It Turned)
Canvas shows today's grade, not how it got there. How to rebuild a course grade's timeline, read the cliff, the slow slide and the catch-up bump, and see it as a chart.
An 82% in Algebra tells you where the grade is. It doesn't tell you where it's going. An 82% that was a 74% a month ago is a comeback. An 82% that was a 91% two weeks ago is a problem. Canvas shows parents the number, but not the line behind it, and the line is usually the more useful part.
Here's how to piece together a grade's history from what Canvas does show you, how to read the shapes you'll see, and a faster way to get the whole timeline.
What Canvas shows you
On the Grades page for a course you see the current total and every assignment with its score. You can arrange the list by due date, title, module, or assignment group. What you won't usually find is a chart of how the course total moved over the term. Canvas calculates the total on the fly from whatever has been graded so far, and it doesn't show you what the total was last Tuesday.
That's why a grade can feel like it changed “out of nowhere.” The change happened when a particular assignment was graded, but nothing points to that moment.
Rebuilding the timeline yourself
You can reconstruct most of the story with a few minutes of work:
- Arrange the Grades page by due date. Work is usually graded within a week or two of its due date, so this roughly matches the order the grade changed in.
- Mark the big swings. Zeros, tests, and anything in a heavily weighted group (Canvas shows the group weights at the side of the Grades page) move the total the most.
- Try what-if scores with your kid. On their Grades page, clicking a score lets them type a hypothetical one, and Canvas recalculates the total. It shows exactly how much a single assignment is costing, and it doesn't touch the real grade.
- Write the total down weekly. A simple note with the date and each class grade, every Sunday, gives you a real timeline going forward. It's low-tech and it works.
Reading the shapes
Once you have a timeline, most grade histories look like one of a few shapes, and each one points to a different conversation.
The cliff
One sharp drop on a single day. Almost always a zero, a missing assignment that got scored, or a big test. The fix is usually specific: make up the work, ask about a retake, or find out whether that zero is a placeholder the teacher will replace.
The slow slide
A point or two lost every week, with no single disaster. This is the one to take seriously. It usually means habits: rushed homework, skipped reading, a unit that never clicked. It's also the hardest to notice without a timeline, because no one assignment looks alarming.
The early-term wobble
Big swings in the first few weeks. With only a handful of grades in, each one moves the total a lot. Don't read much into a single wobble; watch where it settles.
The catch-up bump
A sudden rise after a flat or falling stretch: late work getting graded, a teacher replacing placeholder zeros, or a strong test. If your kid has been catching up, this is the shape that proves it.
Why weighting matters
Many classes weight assignment groups, for example tests 50%, homework 20%. In a class like that, one test can move the grade more than ten homework assignments. When the line bends, check which group the graded work was in before deciding how worried to be.
The whole timeline, automatically
GradeGlance draws this for you. Each course has a grade-over-time chart built from the date every assignment was graded, across the current grading period. Because it's rebuilt from Canvas data, the chart covers the whole grading period from the day you connect, not just from when you signed up. You can switch it to a breakdown by assignment group to see whether tests or homework moved the line, and hover any point to see the assignment and its score.
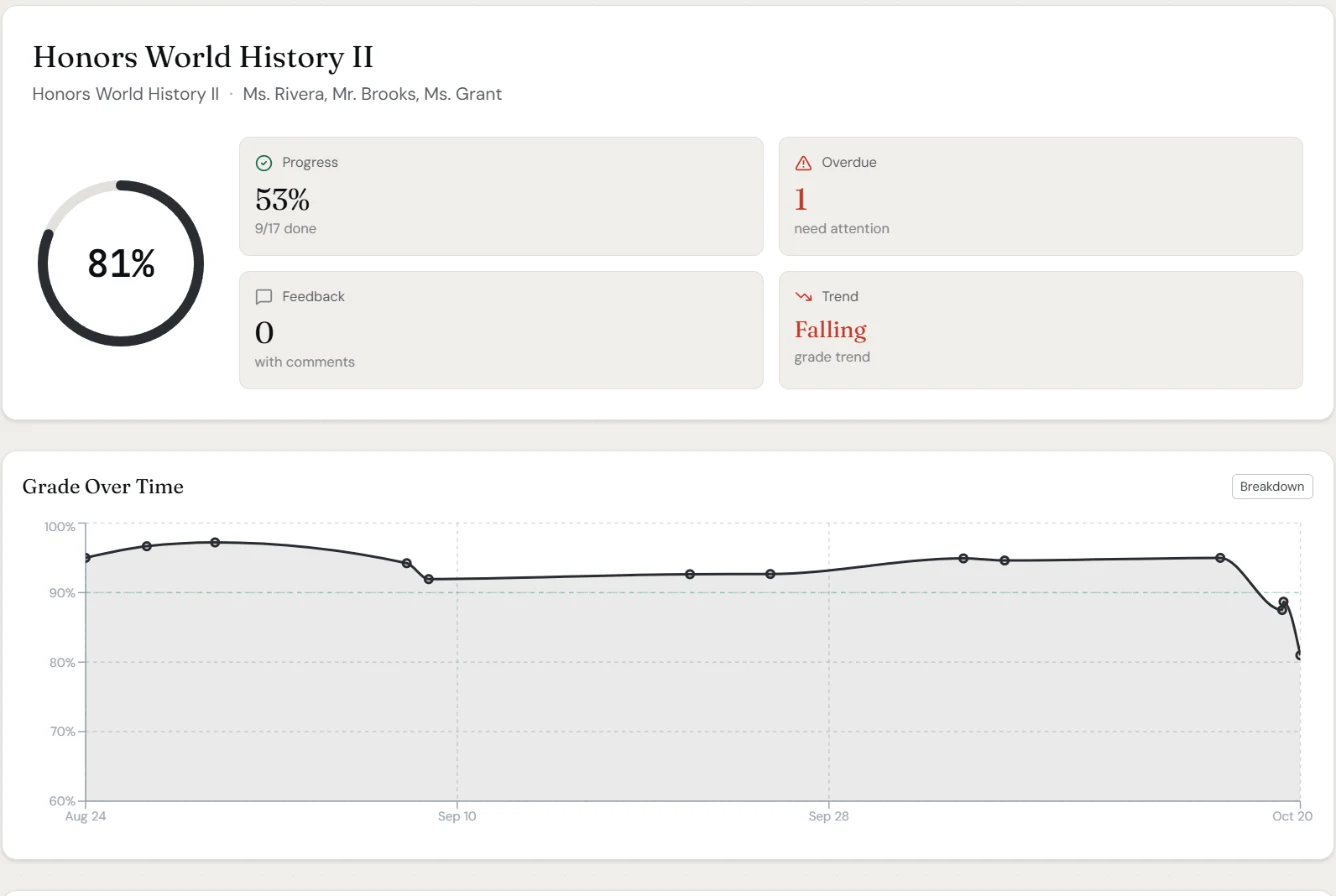
On each kid's dashboard, class grades also show an arrow when they've moved 3 or more points over about two weeks, so you know which chart to open. And if you want to know what to do once you spot a slide, read how to catch a falling grade before it's too late.